Magic Madgwick Filter for Attitude Estimation
Table of Contents:
- 1. Deadline
- 2. Problem Statement
- 3. Reading the data
- 4. Sensor Calibration
- 5. Implementation
- 6. Notes About Test Set
- 7. Submission Guidelines
- 8. Allowed and Disallowed functions
- 9. Collaboration Policy
- 10. Acknowledgements
1. Deadline
11:59 PM, September 10, 2019.
2. Problem Statement
In this project, you will implement a Madgwick filter to estimate the three dimensional orientation/attitude. You are given data from an ArduIMU+ V2 six degree of freedom Inertial Measurement Unit (6-DoF IMU) sensor i.e. readings from a 3-axis gyroscope and a 3-axis accelerometer. You will estimate the underlying 3D orientation and compare it with the ground truth data given by a Vicon motion capture system.
3. Reading the Data
The Data folder has two subfolders, one which has the raw IMU data Data\Train\IMU and another one which has the Vicon data Data\Train\Vicon. The data in each folder is numbered for correspondence, i.e., Data\Train\IMU\imuRaw1.mat corresponds to Data\Train\Vicon\viconRot1.mat. Download the data from here. These data files are given in a .mat format. In order to read these files in Python, use the snippet provided below:
>>> from scipy import io
>>> x = io.loadmat("filename.mat")
This will return data in a dictionary format. Please disregard the following keys and corresponding values: __version__, __header__, __global__. The keys: vals and ts are the main data you need to use. ts are the timestamps and vals are values from the IMU. Each column of vals denotes data in the following order: . Note that these values are not in physical units and need to undergo a convertion.
To convert the acceleration values to , follow these steps.
Follow the same steps for and . Here represents the value of in physical units, is the bias and is the scale factor of the accelerometer.
To read accelerometer bias and scale parameters, load the Data\IMUParams.mat file. IMUParams is a vector where the first row denotes the scale values . The second row denotes the biases (computed as the average biases of all sequences using vicon) .
To convert to ,
Here, representes the value of in physical units and is the bias. is calculated as the average of first few hundred samples (assuming that the IMU is at rest in the beginning).
From the Vicon data, you will need the following 2 keys: ts and rots. ts is the timestamps of size as before and rots is a matrix denoting the Z-Y-X Euler Angles rotation matrix estimated by Vicon.
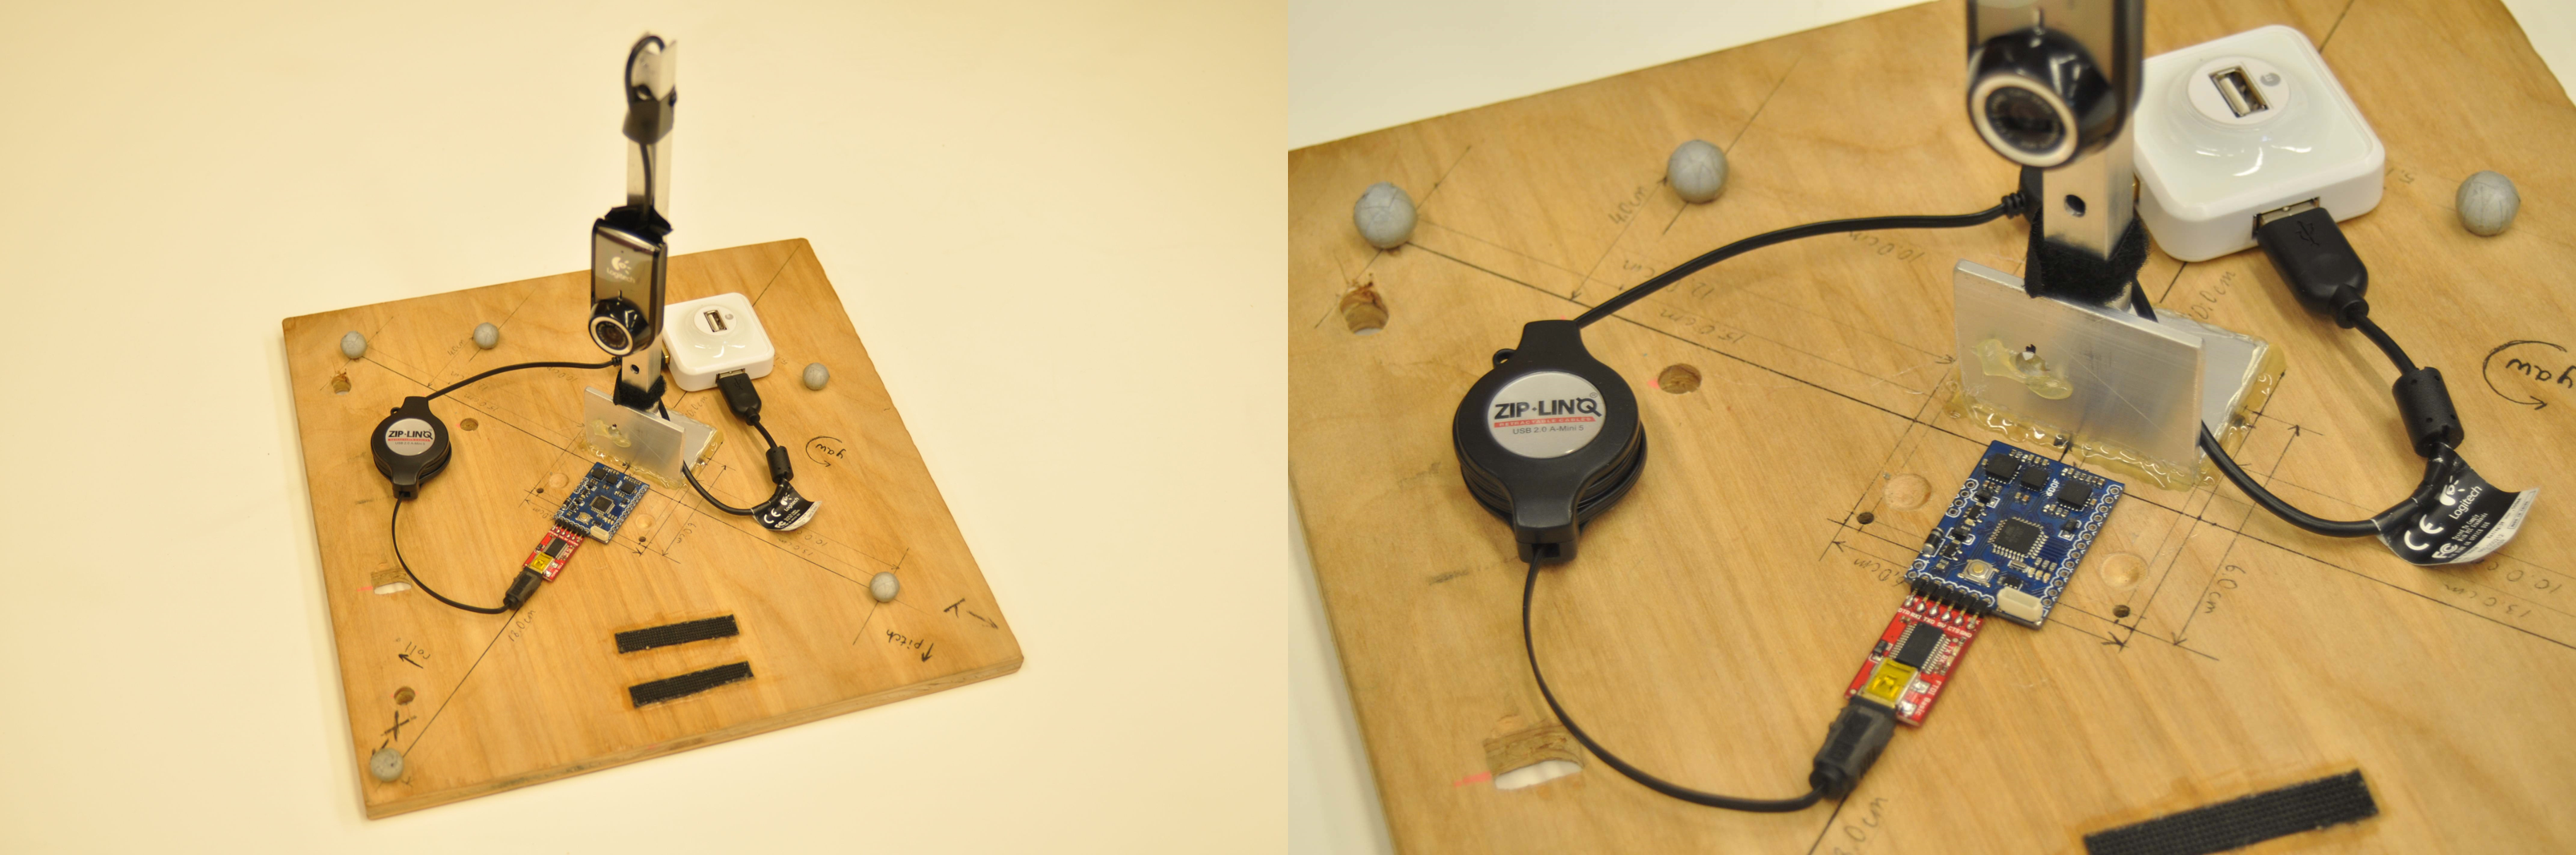
An image of the rig used for data collection is shown below:
4. Sensor Calibration
Note that the registation between the IMU coordinate system and the Vicon global coordinate system might not be aligned at start. You might have to align them.
The Vicon and IMU data are NOT hardware syncronized, although the timestamps ts of the respective data are correct. Use ts as the reference while plotting the orientation from Vicon and IMU. You can also do a software stncronization using the time stamps. You can align the data from the two closest timestamps from IMU and Vicon data respectively.
5. Implementation
- You will write a function that computes orientation only based on gyro data (using integration, assume that you know the initial orientation from Vicon). Check if that works well. Plot the results and verify. Add the plot to your report file.
- You will write another function that computes orientation only based on accelerometer data (assume that the IMU is only rotating). Verify if that function works well before you try to integrate them into a single filter. THIS IS VERY IMPORTANT! Add the plot to your report file.
- Now, write a function for Madgwick filter that computes orientation based on gyroscope and accelerometer data only. Make sure you plot the orientation in all axis and compare with Vicon plots. Show the plot in your report as well.
In the starter code, a function called rotplot.py is also included. Use this function to visualize the orientation of your output. To plot the orientation, you need to give a rotation matrix as an input.
6. Notes About Test Set
A test set will be released 24 hours before the deadline. You can download the test set from here. Your report MUST include the output from both the train and test sets.
7. Submission Guidelines
If your submission does not comply with the following guidelines, you’ll be given ZERO credit.
7.1. File tree and naming
Your submission on ELMS/Canvas must be a zip file, following the naming convention YourDirectoryID_p1a.zip. If you email ID is abc@umd.edu or abc@terpmail.umd.edu, then your DirectoryID is abc. For our example, the submission file should be named abc_p1a.zip. The file must have the following directory structure. The file to run for your project should be called YourDirectoryID_p1a/Code/Wrapper.py. You can have any helper functions in sub-folders as you wish, be sure to index them using relative paths and if you have command line arguments for your Wrapper codes, make sure to have default values too. Please provide detailed instructions on how to run your code in README.md file.
NOTE: Please DO NOT include data in your submission. Furthermore, the size of your submission file should NOT exceed more than 20MB.
The file tree of your submission SHOULD resemble this:
YourDirectoryID_p1a.zip
├── Code
|   ├── Wrapper.py
|   └── Any subfolders you want along with files
├── Report.pdf
└── README.md
7.2. Report
For each section of the project, explain briefly what you did, and describe any interesting problems you encountered and/or solutions you implemented. You must include the following details in your writeup:
- Your report MUST be typeset in LaTeX in the IEEE Tran format provided to you in the
Draftfolder and should of a conference quality paper. Feel free to use any online tool to edit such as Overleaf or install LaTeX on your local machine. - Link to the
rotplotvideos comparing attitude estimation using Gyro Integration, Accelerometer Estimation, Madgwick Filter and Vicon. Sample video can be seen here. - Plots for all the train and test sets. In each plot have the angles estimated from gyro only, accelerometer only, madgwick filter and Vicon along with proper legend.
- A sample report for a similar project is given in the
.zipfile given to you with the nameSampleReport.pdf. Treat this report as the benchmark or gold standard which we’ll compare your reports to for grading.
8. Allowed and Disallowed functions
Allowed:
- Any functions regarding reading, writing and displaying/plotting images in
cv2,matplotlib - Basic math utitlies including convolution operations in
numpyandmath - Any functions for pretty plots
- Quaternion libraries
- Any library that perform tranformation between various representations of attitude
Disallowed:
- Any function that implements in-part or full Madgwick filter
If you have any doubts regarding allowed and disallowed functions, please drop a public post on Piazza.
9. Collaboration Policy
NOTE: You are STRONGLY encouraged to discuss the ideas with your peers. Treat the class as a big group/family and enjoy the learning experience.
However, the code should be your own, and should be the result of you exercising your own understanding of it. If you reference anyone else’s code in writing your project, you must properly cite it in your code (in comments) and your writeup. For the full honor code refer to the ENAE 788M Fall 2019 website.
10. Acknowledgements
This data for this fun project was obtained by the ESE 650: Learning In Robotics course at the University of Pennsylvania.